This page shows any and all IoT devices you have installed and which agent dashboard each is assigned to.

Each device can have its own Nickname or friendly name to more easily remember what and where the device is.
In the above image, you see this member has four IoT devices. The member just received his devices and has activated them to their account.
Only one device is associated to an agent dashboard and the member will associate the rest with either the same agent or another.
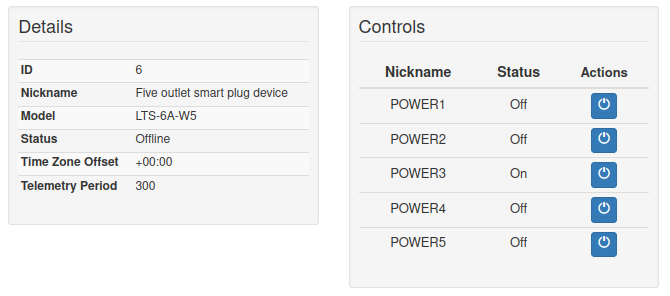
Clicking on the Actions, Dashboard icon takes you directly to the devices details. Here you'll find both information about the device and its settings along with control options.

Clicking on the Actions, Update icon allows you to change a few settings as described below.
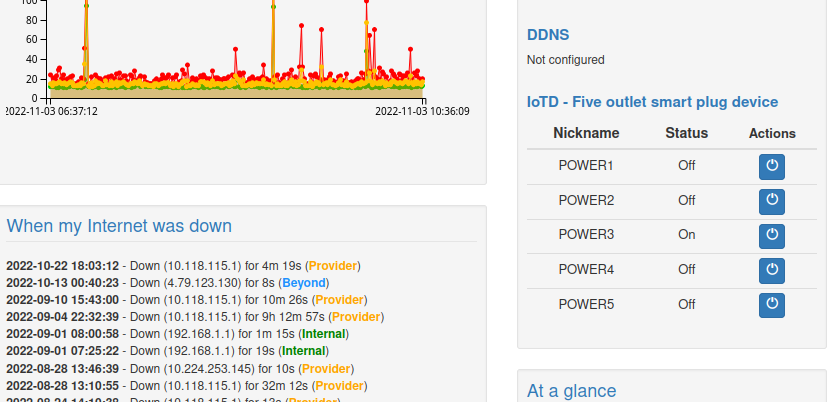
In addition to having the ability to control the device from this page, controls are also made available in the dashboard of the agent that you have assigned the device to.

The purpose behind assigning the device to an agent dashboard has two functions.
First, most people will want to control smart devices installed at the same location where the Internet is being monitored. As such, controls are made available in the same dashboard of the agent that is at the same location.
Second, the OutagesIO network will recognize when an IoT device has not communicated in a certain amount of time based on your Telemetry Period.
This can help to confirm that your Internet monitoring agent is reliably observing disconnections and other problems.
Therefore, running both an agent and at least one IoT device at the same location can help improve overall monitoring results.
Columns are explained as follow.
Telemetry period
The device is set to check in every x seconds/minutes. When it checks in, it sends its current status to update the database about any changes.
This is also the period of time that is used for OutagesIO to recognize that the device has not checked in.
If the device has not checked in at least twice, it will be flagged as having an Offline status.
At this point, either the Internet connection is experiencing problems or the device itself has lost network access.
For Community level reports, the Telemetry Period is set to the OutagesIO default of five minutes.
For Extended level reports, a drop down allows changing the Telemetry Period if needed.
This is important when monitoring a critical location where faster reporting may be needed.
Status
Based on the above checks, the status will be either Online or Offline if it has not checked in as stated in the Telemetry Period.
ID
This is the ID of the IoT device. When posting for help, please include the ID so that support can look it up to help you.
Nickname
You may set a Nickname by clicking on the edit pencil icon that can be used to identify this device using a friendly name.
Model
The model is used by OutagesIO to keep track of the various hardware that we sell.
Time zone offset
All devices are set to UTC time and converted to your time based on the timezone that the agent was set for.
Actions
Mousing over the icons will show their function.
The first one is the dashboard of the device and the second is the edit option to change Nickname and optionally change the Telemetry Period.


