Track Internet disconnections, provider outages with historical data, and automated speed testing.
For Windows, Linux, ARM64, ARMa7. Learn more by visiting www.outagesio.com
Notice: If you created an account on app.outagesio.com, simply use the same credentials to log in here.
Historical menu (Extended reports) - Speed test
-
While the Standard view dashboard shows the last 50 automated Internet speed test results, the historical menu provides an ongoing, historical record including ranges and columns that allow filtering.
The default historical view is one week. If no data shows, try changing the range to two weeks, a month and so on.
Mousing over events gives all of the details available about the speed test and its results.
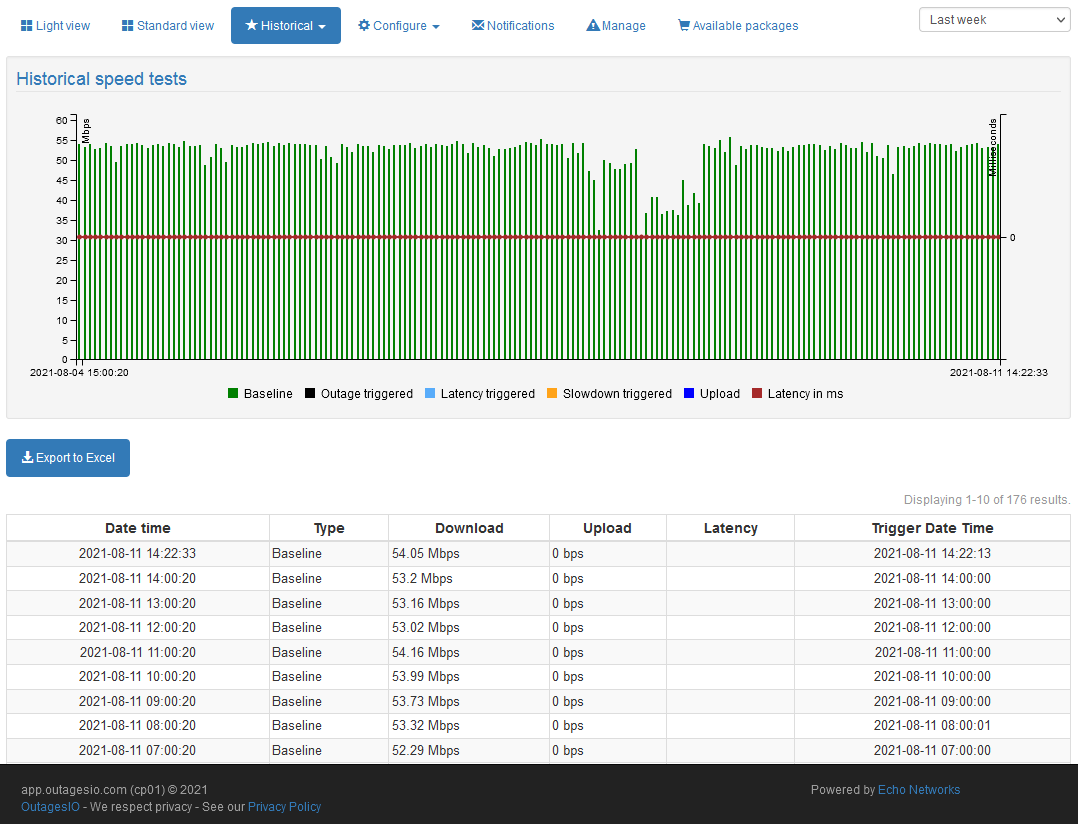
The historical speed tests page was updated around Aug 10/2021.In the historical speed tests menu, members may select a certain date range which gives an overall view of speed test results over that period of time. When selecting a range such as one week, one month and so on, all results for that period will be shown.
The graph is broken down as follows.
On the left hand side are the download and upload speeds in Mbps.
On the right hand side is the milliseconds of the latency results.
Underneath, the starting date/time and ending date/time is shown along with elements which can be enabled or disabled.Just below the graph, an Excel report can be downloaded and is generated based on the selected range.
Below the export option, the graph data are shown in a text version which allows filtering and sorting.
Note: If you see no Upload or Latency in the text below, it means this agent is not running the new speed test version.
-
E EchoMin locked this topic on