Track Internet disconnections, provider outages with historical data, and automated speed testing.
For Windows, Linux, ARM64, ARMa7. Learn more by visiting www.outagesio.com
Notice: If you created an account on app.outagesio.com, simply use the same credentials to log in here.
Environment sensor enabled hardware agents
-
An optional environment sensor can be connected to select hardware agents to be used with the OutagesIO service. These agents can be used with or without Internet monitoring enabled.
Here is a short article touching on this agent and environment sensing.
Monitor Internet connectivity and environmental conditionsWhen added, the sensor can monitor metrics including temperature, humidity, light, barometric pressure, sound, air quality, and even vibration and seismic activity where the agent is installed.
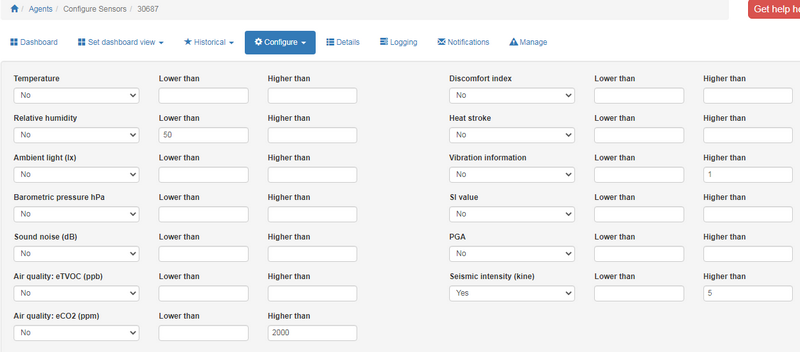
Each metric can be set to alert someone if an upper or a lower level has been reached. For example, if temperatures go below or higher than a set range or if humidity becomes too high, alerts can be sent.
Notifications can be via email, dashboard, a combination and even using SMS (US only).

Note that some metrics must be sustained in order for an alert to be sent. For example, if a vibration occurs but is not sustained, no alert will be sent. This is because the metrics are checked and sent on regular loop so if a short event occurs before the next update, it may not be sent.
The amount of time for the loop duration can be changed depending on your application and requirements. Contact us if this is a requirement as it means other timings will need to be adjusted.
Alerts
All of the environment metrics can be set to either email or dashboard alert as needed.
For example, temperature could be set to 10F. If temperature goes below 10F, an alert is sent. Similarly, temperature could be set to 10F low and 99F high. If temperature goes below or higher than what is set, an alert will be sent out.
Below are the allowed values and ranges
Atmosphere
-Ambient light: 0 to 30000, units 1 lx
-Sound/noise: 33.00 to 120.00, units 0.01 dB
-Temperature: -40.00C to 125.00C, units 0.01 degC
-Relative humidity: 0.00 to 100.00, units 0.01 %RH
-Barometric pressure: 300.000 to 1100.000, units 0.001 hPa
-Discomfort index: 0.00 to 100.00, units 0.01. Expresses the heat and humidity of summer in a quantitative manner. It is calculated from temperature and humidity.
-Heat stroke: -40.00 to 125.00, units 0.01 degC. Expresses the risk of heat stroke in a quantitative manner. It is calculated from temperature and humidity.Air quality
-eTVOC: 0 to 32767, units 1 ppb. Equivalent total volatile organic compounds. Average TVOC concentrations between 50 ppb and 325 ppb are considered acceptable but should not peak above 500 ppb.
-eCO2: 400 to 32767, units 1 ppm. Equivalent calculated carbon-dioxide. 350-1,000 ppm concentrations are typical of occupied indoor spaces with good air flow.Seismic/Earthquake
Wall, floor, equipment cabinet and/or earthquakes are recorded, each with their own metrics and combined. Earthquakes will be displayed as separate events in graphic format.
-Vibration count: Accumulated vibration counts with or without earthquake occurring.
-SI value: 0.0 to 6553.5, units 0.1 kine. An index that expresses the effect a certain vibration has on a structure. It has a correlation with seismic intensity. It is calculated from the acceleration values of 2 horizontal axes.
-PGA: 0.0 to 6553.5, units 0.1 gal. Peak acceleration value of a certain interval. It is calculated by resultant acceleration of 2 horizontal axes.
-Seismic intensity: 0.000 to 65.535, units 0.001. A value correlated with seismic intensity that is calculated from the SI value.IMPORTANT
The sensor metrics are sent at a periodic polling time. For example, if the sensor is being polled every 60 seconds, the dashboard update will show metrics for that exact moment the sensor was polled.During the idle period, if for example a vibration occurred, it may not be shown in the dashboard because the next polling period did not pick that up. This is because the sensor keeps a very short history of events which are reset too quickly.
Please keep in mind that sustained changes are more likely to show in your dashboard such as temperature, humidity and others which generally are not very short lived events.
By setting dashboard alerts, you can generate a historical log of events based on your settings.
Short lived, reset metrics is something we are aware of and hope to resolve in the near future.
-
E EchoMin locked this topic on
-
K KelAuth referenced this topic on
