Track Internet disconnections, provider outages with historical data, and automated speed testing.
For Windows, Linux, ARM64, ARMa7. Learn more by visiting www.outagesio.com
Notice: If you created an account on app.outagesio.com, simply use the same credentials to log in here.
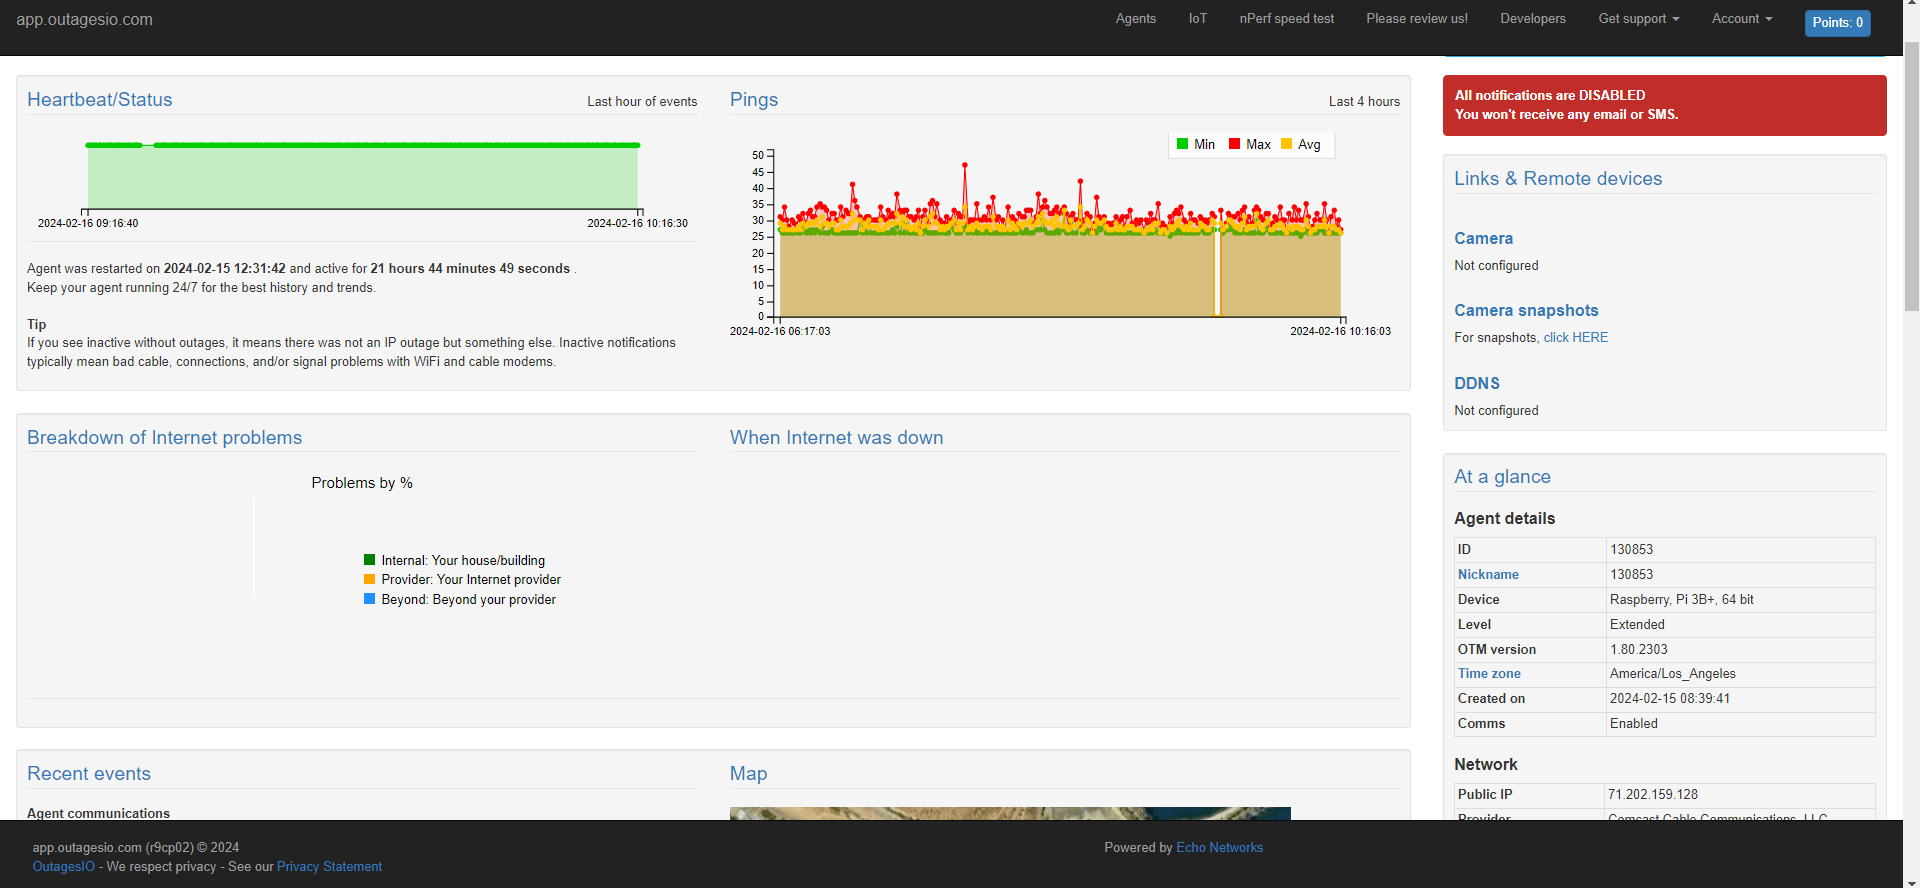
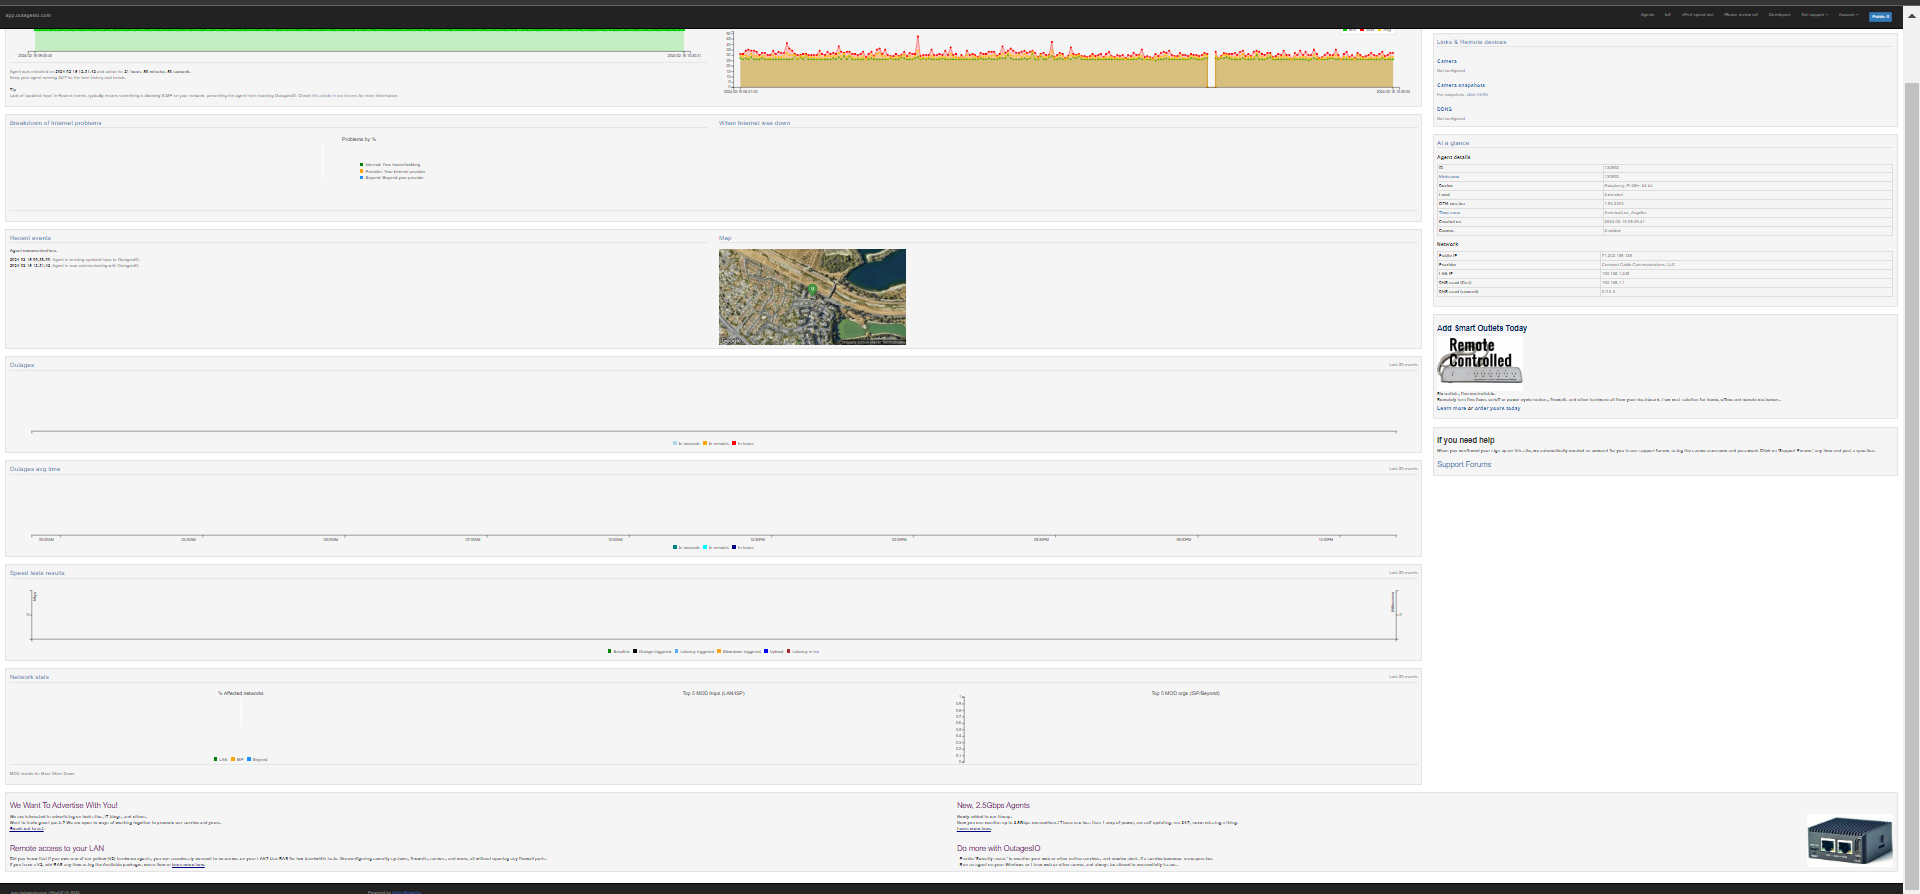
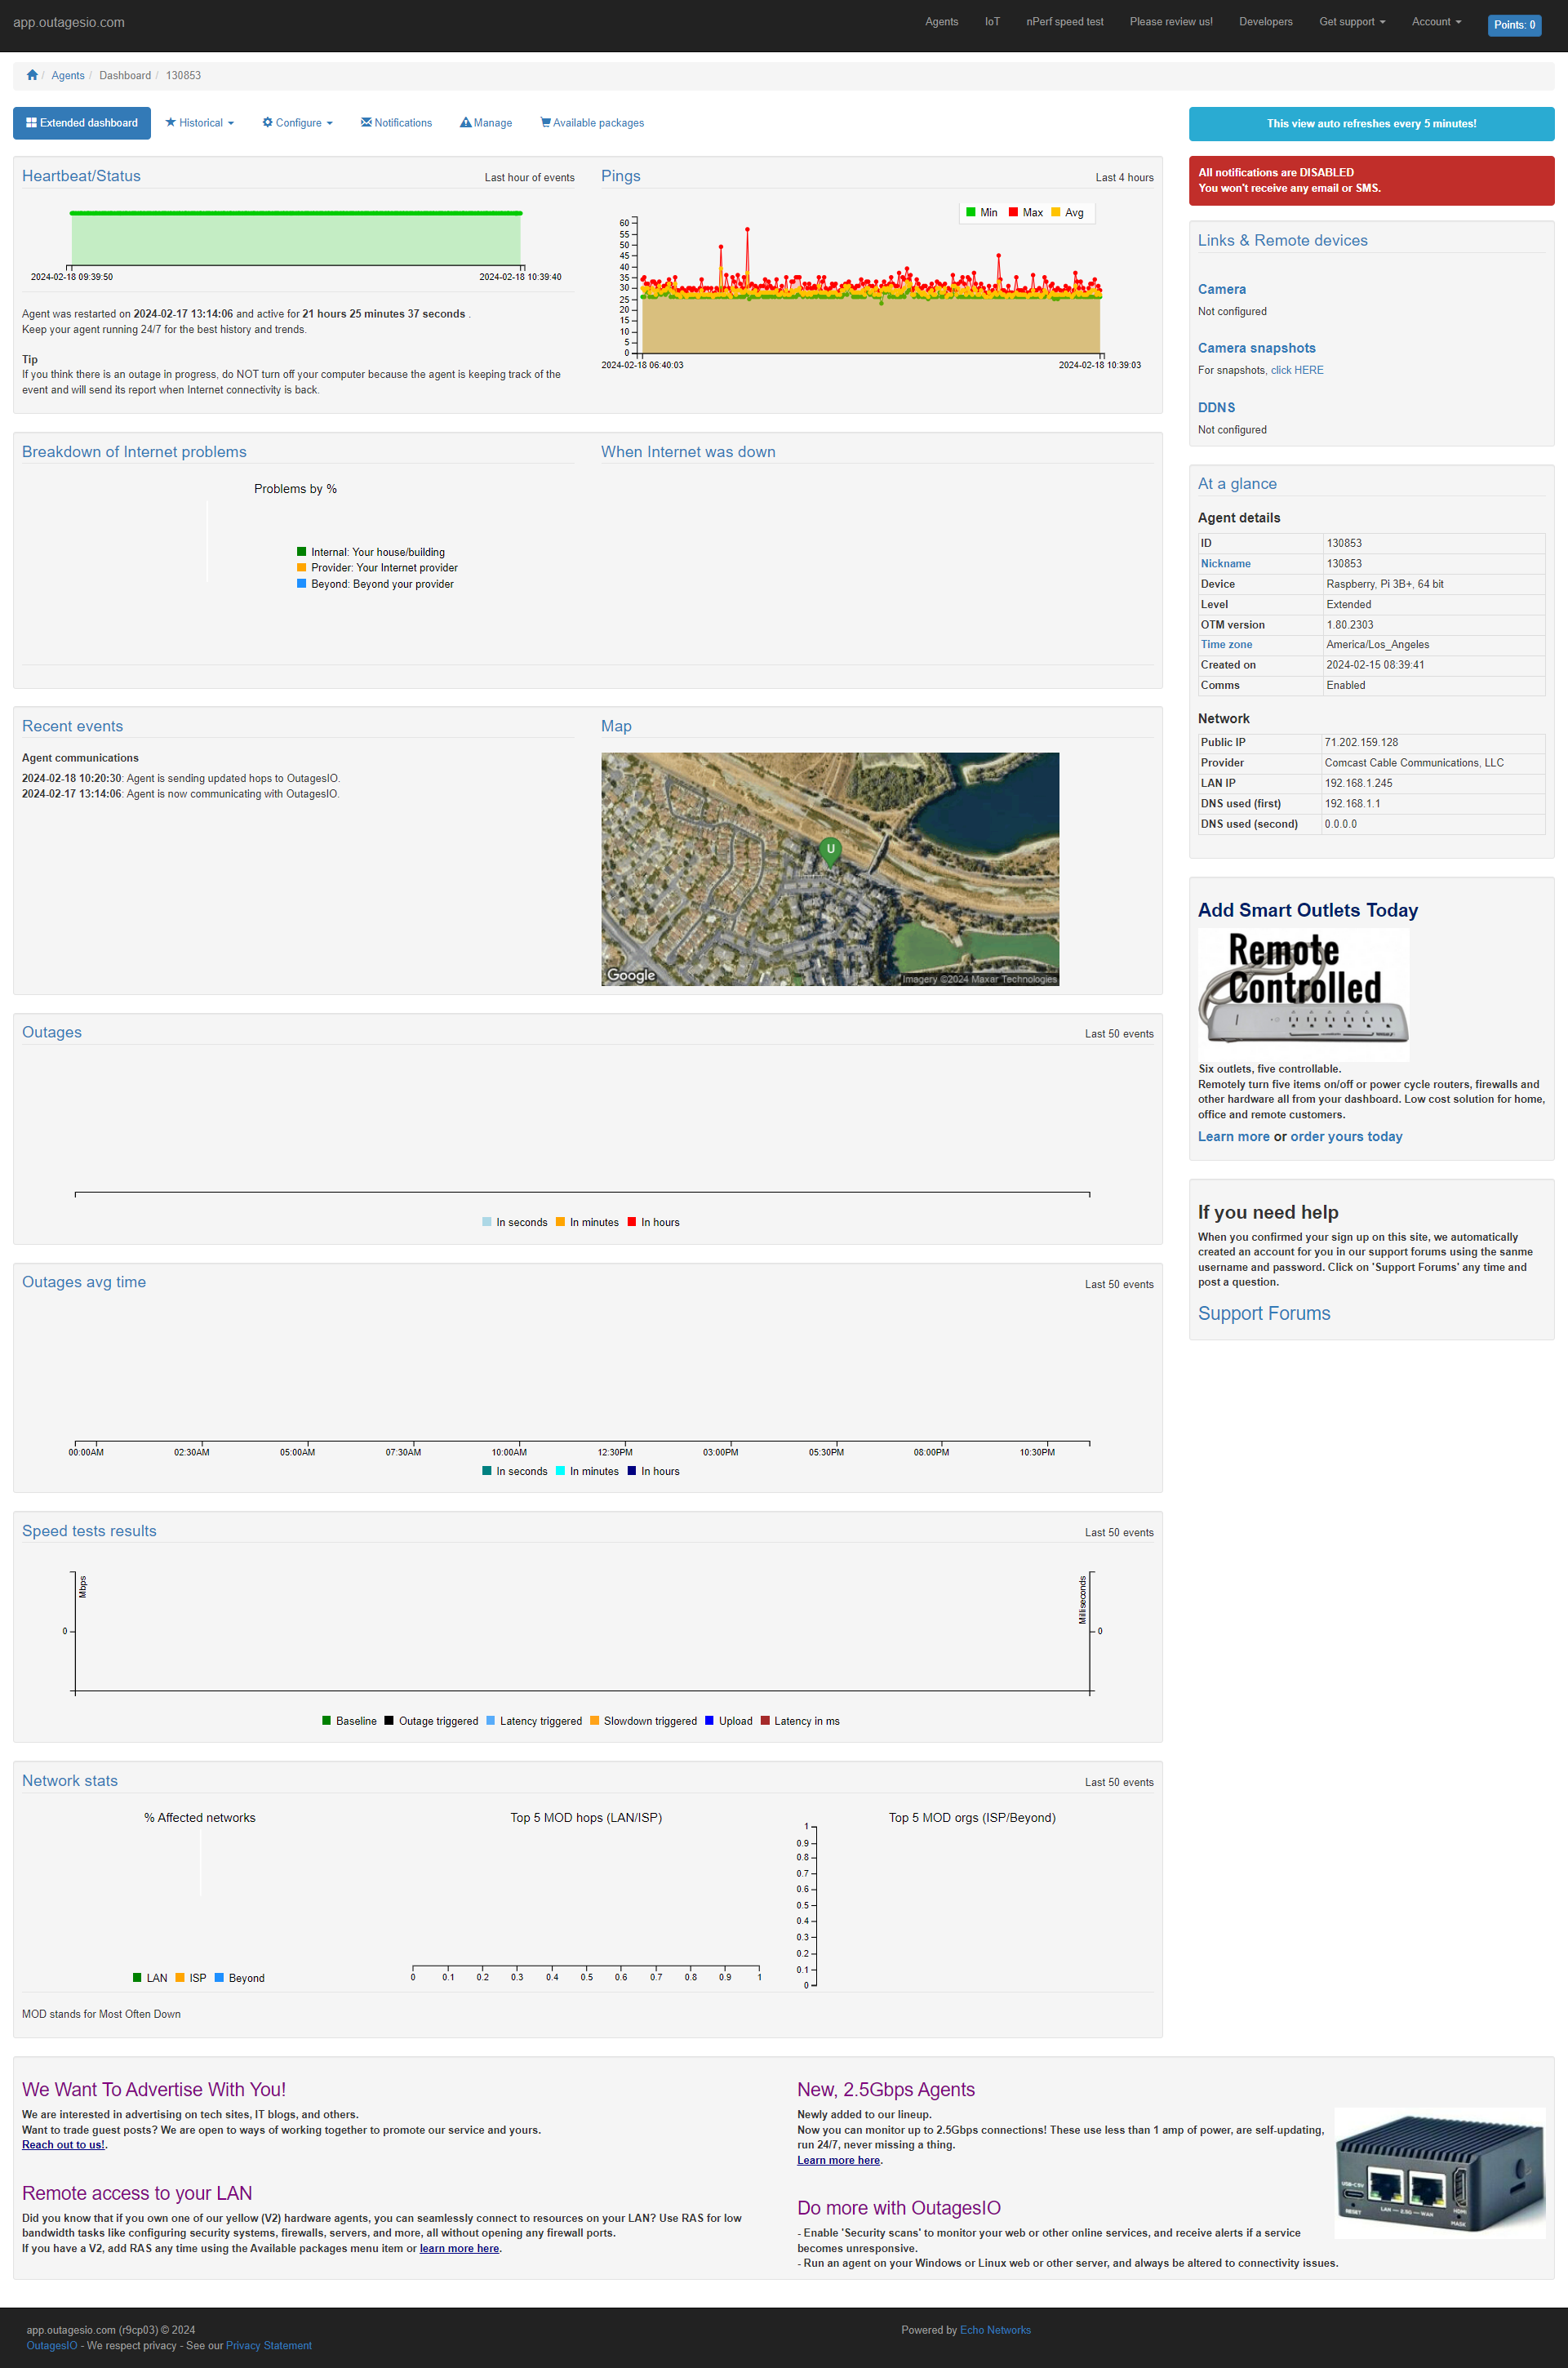
Extended Dashboard Not Listing Outages
-
I don't know why it would have stopped. It had been running for 20+ hours. Anyway, I got the agent running again by deleting the otm_binary and restarting manually, as it did not want to startup without deleting the otm_binary first. Not sure why.. Here is the console output when I ran the startup.sh :
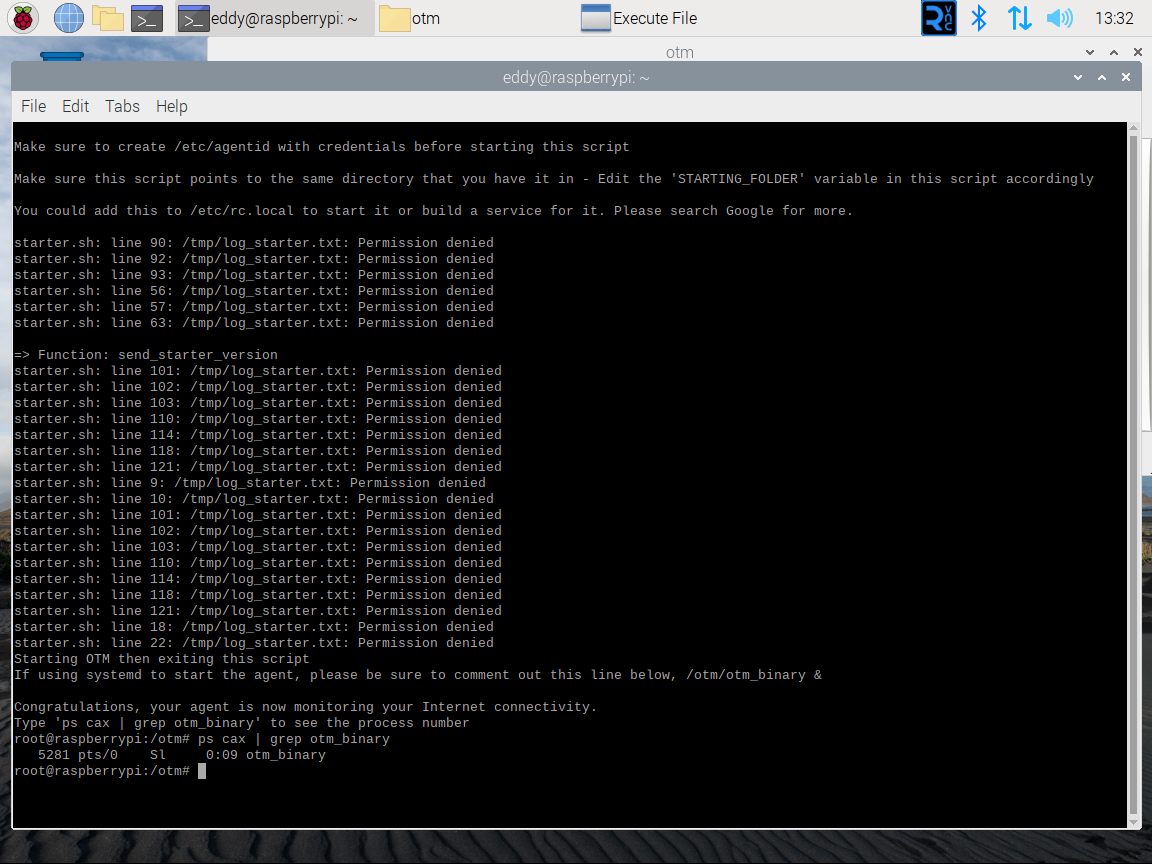
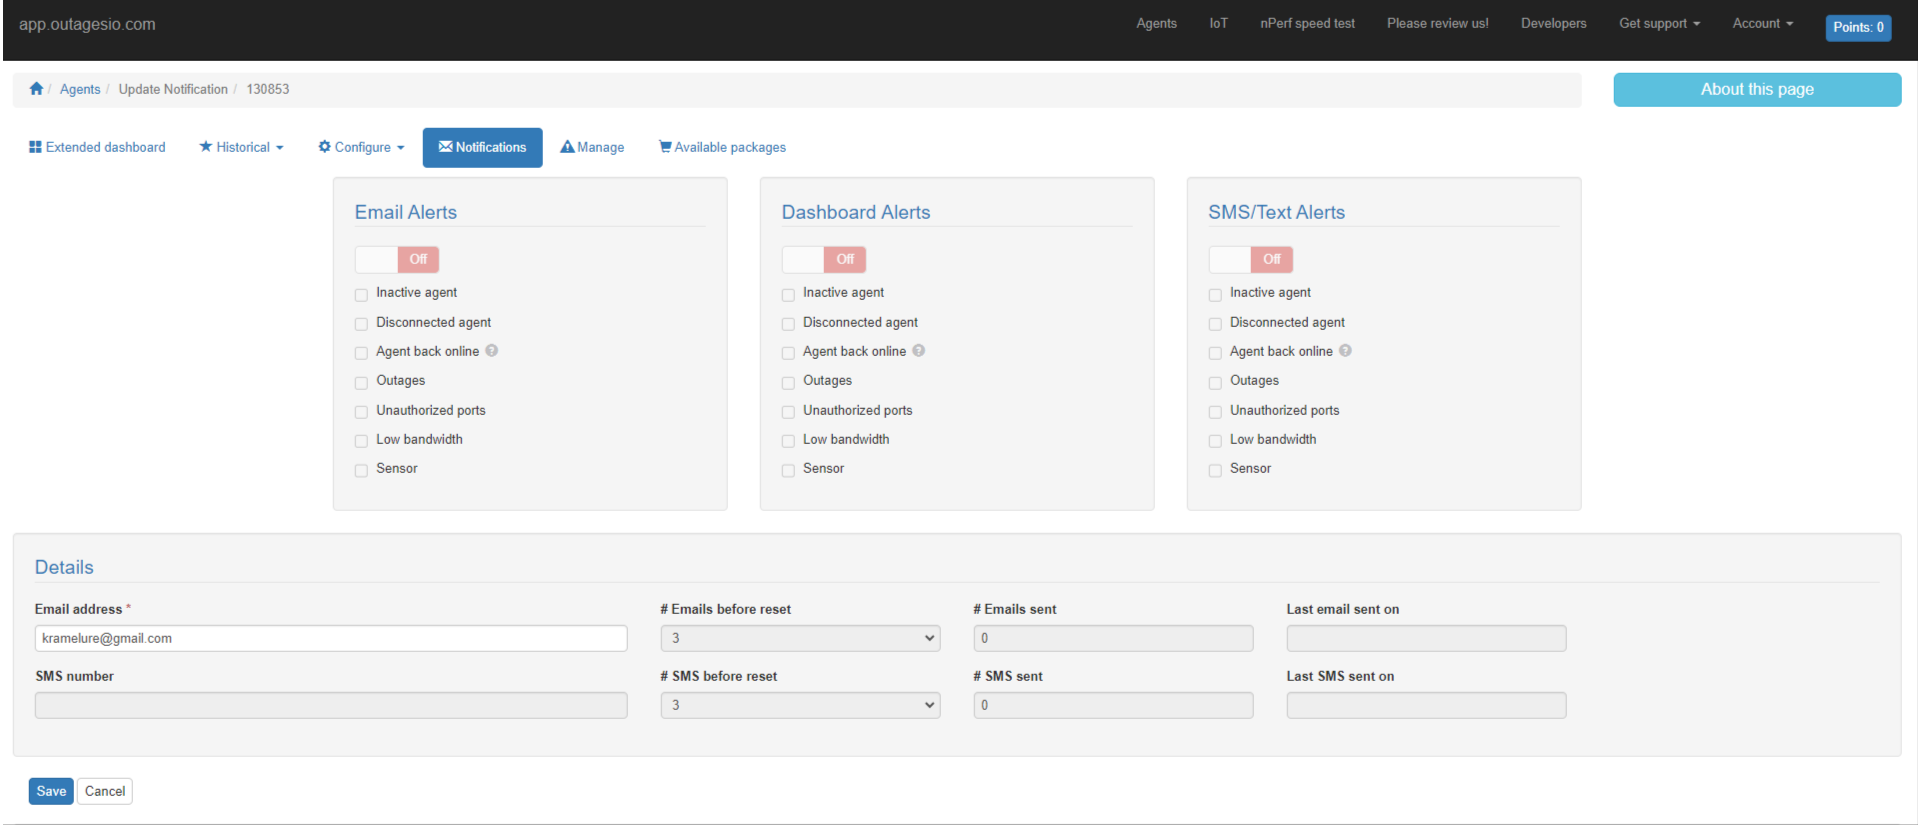
Says the agent is running, after the permissions errors for the log file. I still cannot activate email or dashboard notifications, nor any other feature. As if the account is still in the pre-staging dashboard. Is rebooting my router a good means to test the dashboard for an outage report? Thanks for your help.
-
Here is the log_starter file contents:
=> Function: create_empty_log
=> Function: check_to_download_new_starter
STARTER scripts are the same.run_curl
curl --silent --connect-timeout 15 --max-time 30 --request POST https://www.foxymon.com/receiver/receiver2.php -u b7RYnmxg5q:GzbqrTOvJwLM6kxsmHSgI40djFQElK15XnehPVtB -F function=send_starter_version -F version=2023-12-28_0700_Phoenix_TZ
Wait 5 seconds
Attempting execution
Answer: 1
CURL executed=> Function: check_to_download_new_otm
run_curl
curl --silent --connect-timeout 15 --max-time 30 --request POST https://www.foxymon.com/receiver/receiver2.php -u b7RYnmxg5q:GzbqrTOvJwLM6kxsmHSgI40djFQElK15XnehPVtB -F function=receive_binary_location
Wait 5 seconds
Attempting execution
Answer: https://downloads.echonets.com/otm/arm64_otm_1_80_2303
CURL executed
https://downloads.echonets.com/otm/arm64_otm_1_80_2303
OTM binaries are different.
Downloading the OTM binary.
Download successful. -
The starter must run with admin privileges (i.e. sudo) and if you decide, as it seems, that you are running it manually and not as a service you have to check that the process is continuously running in background.
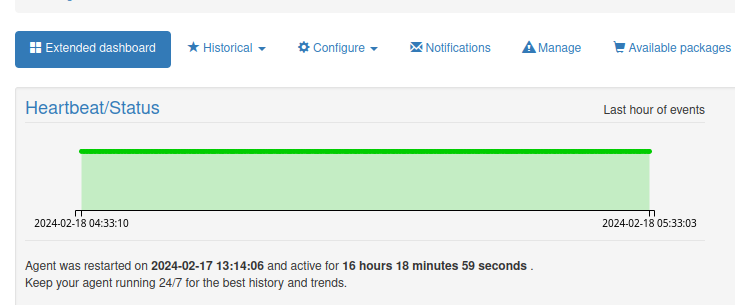
In this right moment the agent is working correctly, it is up and running as this message below the Heartbeat/Status graph is saying...
"Agent was restarted on 2024-02-17 13:14:06 and active for 16 hours 16 minutes 14 seconds .
Keep your agent running 24/7 for the best history and trends." -
Also keep in mind that restarting your router is not an outage, it's considered a disconnection. The agent will always log IP outages when it detects them. Since there have not been any outages, there is nothing to log which is why you see nothing.
Data will only show up in your dashboard if/when outages happen. Remember that the main point of the service is to monitor your provider, the rest of the information is just FYI.
As Ed mentioned, just make sure that the agent is always running and if it is, it will catch the problems as they show up.
Lastly, if you'd like to convert this from manual to automatic service, follow the help in this article. This way, you will not have to manually start it or have it disabled on you if you log out and didn't spawn a process.
https://www.outagesio.com/monitor-your-internet-with-raspberry-pi-nanopi-and-other-arm-devices/
-
I wasnt aware of anything other than the Monthly (or Yearly) subscription for software agents. My understanding is that sensors are only available for hardware agents. My paypal receipt shows "OutagesIO Monthly, 5.95" Profile ID: I-6G87HL7BLFTP. It doesn't mention anything about a sensors subscript. There was an issue activating the upgrade (it didn't immediately upgrade after paypal pmt), so I suspect someone activated the wrong subscript type. when I dealt with support. Sounds logical to me :)
-
 O OutagesIO_Support marked this topic as a question on
-
 O OutagesIO_Support has marked this topic as solved on

